

C-Aware IDE Features
Editor Overview
The C-Aware Editor is the main work area of the IDE and the place where the user enters and edits source code. The editor provides color syntax highlighting, tab control, bookmarks, context sensitive help and searches for matching } or ). The C-Aware IDE allows easy access to the call tree, symbol map and other helpful screens. It also includes a direct interface to device programmers and debuggers.
Context Sensitive Help
The IDE provides instant help on any item by pressing F1. For example, placing the editor cursor on an output_high() function and pressing F1 will open the compiler manual on the output_high() function.
Code Completion and Code Insight
The IDE can provide code completion assistance by pressing CTRL-SPACE on the keyboard. Doing so will open a small hint window showing all the valid identifiers that can be used. When used after a class dereference ('.' or '->') the assistance will show all valid items in that class.
Brace Matching
When the edit cursor is on a brace ('{', '}', ')', '(', '[' or ']') the editor will highlight both braces. Pressing CTRL-] on the keyboard will also move to the cursor to the matching brace.
Identifier Tooltips
By hovering the mouse over an identifier or keyword (such as a variable, function name or constant) the IDE will provide a tooltip with information on that identifier. If the debugger is running and the mouse is hovering over a variable, the debugger will display the variable's current value in the tooltip.
Code Folding
The editor has the ability to fold (collapse or expand) certain blocks of code into one line. This is useful for hiding an entire function, comment block or #if/#else block. Code that can be collapsed or expanded will be marked by a + or - minus sign next to the gutter.
Color Highlighting
The editor provides color syntax highlighting for compiler keywords,comments, preprocessors, string, numbers, symbols, block matches and more. The colors can be configured, or turned off entirely, by using the 'IDE Options' in the 'Options' menu.
The editor also allows user defined tokens to be added for color syntax highlighting by putting them in a file names TOKENS.TXT in the PICC directory with one keyword per line.
Line Numbers
The gutter on the left shows the line number of each line. This can be turned off by using the 'IDE Options' in the 'Options' menu. If the debugger is enabled, a breakpoint can be toggled on a line by double clicking on the line number in the gutter.
Mouse Right-click Pop-up
Right mouse click in the editor window displays a pop-up menu of editor actions.
Column Editing
Press the CTRL key on the keyboard while using the left mouse button on the mouse to select a block of text. This will allow the user to highlight/select a block of text across several lines of the file, but only spanning a specified number of columns and not the entire length of the line. This is useful if there are several lines that start or contain the same block of text but need to be replaced or edited. Pressing DEL will delete that block of text, typing will replace block of text with new text, or CTRL-V could be used to paste new content in each line.

User Tool Bar Menu
This menu contains buttons configured by the user. To add buttons to the menu, use the 'Toolbar' screen in the 'IDE Options' of the 'Options' menu.
File Menu
The File button on the main menu opens the File Menu. This menu can be used to open and close files or projects. The menu will also show all the recent projects and files opened by the editor; by clicking on one of these files or projects the IDE will open them.
File menu features:
|
Source File Creates new source file (.c or .h file) |
|
|
Project Wizard The wizard will allow the user to specify the project parameters and when complete a .C, .H and .PJT file are created. Standard source code and constants are generated based on the specified project parameters. Easily add any of the following functions to a project: USB, TCP/IP, I/O Pins, Timers, LCD, Capacitive Touch, RTCC, CCP & Comparator, MODbus/CANbus. |
|
|
Create Project Creates a new project manually. Only a .CCSPJT file is created to hold basic project information. An existing .C main file may be specified or an empty one may be created. |
|
|
RTF File Opens the RTF Editor program which is a fully featured RTF editor to make a new RTF file. |
|
|
Flow Chart Open the flow chart editor program included with C-Aware for quick and easy charting to make a new flow chart. |
|
|
Any File Opens a file of any type into the editor. |
|
|
Source File Opens a source file (.c or.h) into the editor. |
|
|
Project Opens a project file (.PJT) into the editor. |
|
|
Output File Opens an output file (.hex, .err, .lst, .sym, .cod, .tre, .sta) in the appropriate editor. |
|
|
RTF File Opens an RTF file into the RFT editor program. |
|
|
Flow Chart Opens a flow chart file in the flow chart editor program. |
|
|
As Hex File Opens a file in the hex editor. |
|
|
As Text File Opens a file as a text file. |

Edit Menu
|
Undo Undoes the last editing action. |
|
|
Redo Redoes the last editing action. |
|
Paste Copies the clipboard contents to the cursor location. |
|
|
Cut Moves the selected text from the file to the clipboard. |
|
|
Copy Copies the selected text to the clipboard. |
|
|
Select All highlights all the text. |
|
|
From File Copies the contents of a file to the cursor location. |
|
|
To File Pastes the selected text to a file. |
|
Unindent Selection The selected area of code will be unindented to the previous tab stop. |
|
|
Indent Selection The selected area of code will be indented |
|
|
Format Source This will start a tool that can format the source code based on the user's formatting criteria. This formatting includes indenting after brackets, spacing around operators and identifiers, etc. |
|
Playback Plays back the last recorded or loaded macro. |
|
|
Record Starts recording the keystrokes to be played back or saved and loaded later. |
|
|
Stop Stops recording the keystrokes to be played back or saved and loaded later. |
|
|
Load Loads the saved macro to be played back. |
|
|
Save Saves the recorded macro to be loaded and played back later. |

Search Menu
|
Down Will search the active file for the next word that matches the search field, in the down direction. When found, the editor cursor will move to that word. |
|
|
Up Will search the active file for the next word that matches the search field, in the up direction. When found, the editor cursor wil move to that word. |
|
|
All Will search all the files in the current project for the word that matches the search field. All matches will be displayed in the output message window. |
|
|
Replace This will open a tool that allows the user to replace one phrase/word with a different phrase/word. |
|
|
Find in Files This will open a tool that allows the user to search all files for a specific phrase/word. |
|
|
Goto Line The user can specify the line number and the cursor moves to the specified line. |
|
Toggle This will toggle a bookmark at the current cursor position and file (if a bookmark exists it will be removed; if a bookmark does not exist it will be added). A bookmark allows a user to mark a position in the file for easy access later. The IDE allows saving 10 bookmarks (0-9). |
|
|
Goto Go to the previously set bookmark position and file for the specified bookmark number. |
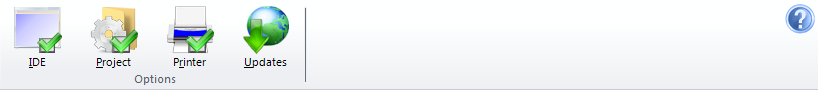
Options Menu
|
IDE All options for configuring the IDE are here. This includes color style, editing style, appearances, external tools, etc. |
|
|
Project Options specific to the current project are here. This includes global defines, include path, etc. |
|
|
Printer Printer configuration options are here. This includes page orientation, paper size, source tray, etc. |
|
|
Updates The IDE can check to see if there are new versions of the compiler available, and can be configured here. |

for more info
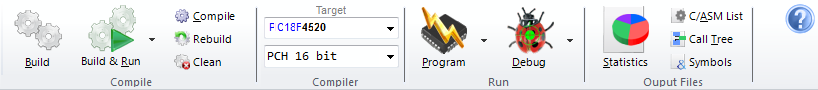
Compile Menu
|
Build This performs a build: compile all changed units and perform the link step that results in the program image in HEX and COF form. Compile messages will be displayed in the output messages window. |
|
|
Build & Run After performing a build, the IDE will use the selected programming tool and program the image to the microcontroller. After a successful program to the microcontroller, the microcontroller will then run the new program. Messages from the compiler and the programmer will be displayed in the output messages window. The arrow next to the button allows the user to select which programming tool to use. These tools can be added or removed using the 'IDE Options' in the 'Options' menu. |
|
|
Compile This will compile the current unit. If the project has only one unit (no linking) then Compile and Build both do the same thing and will create the program image (in HEX and COF form). If the project has multiple units (linking) it will only compile the current unit and create the intermediate files of that unit (no program image in HEX or COF form will be made). |
|
|
Rebuild The Build action will normally only compile units that have changed. The Rebuild action will forcefully rebuild all units, even if the unit has changed since last build. |
|
|
Clean This will remove all the output files from the compiler for this project. |
|
Target This pull-down allows you to select the target device. |
|
|
Compiler This pull-down allows you to select the compiler. |
|
Program Program the microcontroller with the project, and if a successful program put the microcontroller in run mode. Output messages from the programmer are displayed in the output messages window. The arrow next to the button allows the user to select which programming tool to use. These tools can be added or removed using the 'IDE Options' in the 'Options' menu. |
|
|
Debug Program the microcontroller with project, but it will do so in debug mode. When the IDE is in debug mode, it allows the user to debug the microcontroller with the project. |
|
Statistics View statistics about the project, such as ROM and RAM usage. |
|
|
C/ASM List Display the list file. The list file shows each C source line and the associated assembly code generated for the line. |
|
|
Call Tree Displays the tree file in the tree file viewer. The tree file viewer graphically shows the call sequence of the program. |
|
|
Symbols Displays the symbol file. The symbol file shows where each function and variable is allocated in memory. |
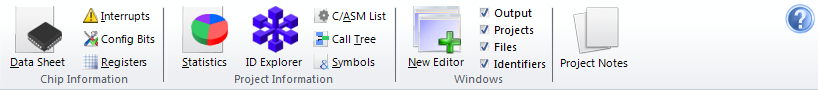
View Menu
|
Data Sheet This tool can be used to view the Manufacturer data sheet for all the Microchip parts supported by the Compiler. If data sheets were not copied tot he disk during the compiler install, then the CCS C Compiler CD-ROM will be needed for this feature. |
|
|
Interrupts This tool displays all the valid keywords for the #INT_XXXX directive and the enable/disable_interrupt function for this device. |
|
|
Config Bits This tool displays all the valid keywords for the #FUSES directive associated with the device that is currently being used. |
|
|
Registers Opens the Special Registers viewer (included in device editor) for viewing off all SFR's for a given part and has the ability to generate custom .h files with the register and bit definitions for specific functions. |
|
Statistics View statistics about the project, such as ROM and RAM usage. |
|
|
C/ASM List Display the list file. The list file shows each C source line and the associated assembly code generated for the line. |
|
|
Call Tree Displays the tree file in the tree file viewer. The tree file viewer graphically shows the call sequence of the program. |
|
|
Symbols Displays the symbol file. The symbol file shows where each function and variable is allocated in memory. |
|
Editor Opens the active file into a new window that isn't docked to the main IDE window. |
|
|
Output Toggle the output message window on or off. |
|
|
Projects Toggle the projects slide out window on or off. |
|
|
Files Toggle the files slide out window on or off. |
|
|
Identifiers Toggle the identifiers slide out window on or off. |
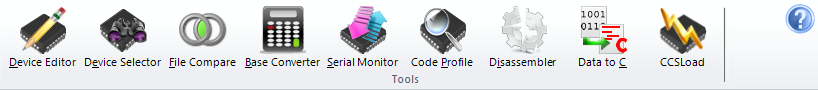
Tools Menu
|
Device Editor View or edit the compiler's database of information for all the microcontrollers supported by the compiler. This includes pins, peripherals, RAM, ROM, and more. |
|
|
Device Selector This tool helps a user select a microcontroller to use based on criteria such as peripherals, pins, RAM, ROM, and more. |
|
|
File Compare Compare two files and highlight the differences between them. |
|
|
Base Converter Convert numbers between decimal, hexadecimal,and float. |
|
|
Serial Monitor Launch CCS's SIOW program, which is a powerful and easy-to-use serial terminal program. The CCS Serial Port Monitor software, called SIOW, is an easy tool to connect to a serial COM port or telnet port. it also offers advanced features such as file transfer, microcontroller bootloading, macros, logging, and graphing. |
|
|
Code Profile Launch CCS's Code Profile program, which utilizes CCS's simple code profile protocol to debug and profile a running program while utilizing minimum amounts of resources on the microcontroller. Unlike in-circuit debugging, this tool grabs information while the program is running and provides statistics, logging and tracing of it's execution. This is accomplished by using a simple communication method between the processor and the ICD with minimal side-effects to the timing and execution of the program. Another benefit of code profile versus in-circuit debugging is that a program written with profile support enabled will run correctly even if there is no ICD connected. |
|
|
Disassembler Convert a HEX or BIN file to assembly. |
|
|
Data to C Converts any file to a valid C file by converting it to a constant char array. Useful for embedding any file into a microcontroller or the source. |

Debug Menu
|
Enable Enable the debugger. This will launch the debugger portion of the C-Aware IDE and program the microcontroller in debug mode. |
|
|
Disable Disable the debugger. This will close the debugger portion of the C-Aware and disconnect from the microcontroller. |
|
|
Run Run the program from the current position. |
|
|
Reset Resets the microcontroller to the beginning of its program. |
|
|
Halt Stop/halt the program. The program in the microcontroller will be halted, and execution will continue from this point on any Run or Step comands. |
|
|
Code Profile Launch CCS's Code Profile program, which utilizes CCS's simple code profile protocol to debug and profile a running program while utilizing minimum amounts of resources on the microcontroller. Unlike in-circuit debugging, this tool grabs information while the program is running and provides statistics, logging and tracing of it's execution. This is accomplished by using a simple communication method between the processor and the ICD with minimal side-effects to the timing and execution of the program. Another benefit of code profile versus in-circuit debugging is that a program written with profile support enabled will run correctly even if there is no ICD connected. |
|
|
Step Into Perform a single step. When stepping, this will step into a function. |
|
|
Step Over Perform a single step. When stepping, this will step over a function. |
|
|
Run to Cursor Program will run until it reaches the position of the edit cursor. |
|
|
Snapshot Allows recording of various debugging info. Allows the user to choose what information should be recorded as well as where to record it and when to record it. The information that can be recorded includes: current time, project name, pc, debugger status, watches, breaks, ram values, and more. |
|
|
Configure Configure the debugger. |
|
|
Debug Windows RAM, ROM, Data EE, Breaks, Stack, Watches, Peripherals, Eval, Monitor, Break Log, RTOS Tasks, SFR, Debug Configure This will open the specified debug dialog window and dock them to their previous location. For more information about each specific window, go here |

Document Menu
|
Document Generate an RTF document detailing the project by using the source code as a template. |
|
|
RTF Editor Open the RTF editing software. |
|
|
Flow Chart Open the flow chart editing sofware. |
|
Quotes Perform a spell check of the current file, but only peforming a spell check of words within quotes. |
|
|
Comments Perform a spell check of the current file, but only performing a spell check of words within comments. |
Help Menu
The CCS C Compiler Help File provides easy access for reference and guidance about how to best take advantage of the features within the C-Aware IDE compiler. These features include: Debugger, Editor, Data Types, Operators, Statements, Preprocessor Commands, Built-in Functions and more...
The Help File provides additional information on Technical Support, Software Updates, Maintenance Prices, Datasheets for Device Drivers, and PIC® MCU Web Resources.
Quickly utilize our comprehensive help system by selecting any statement of your code and simply pressing the F1 key.


